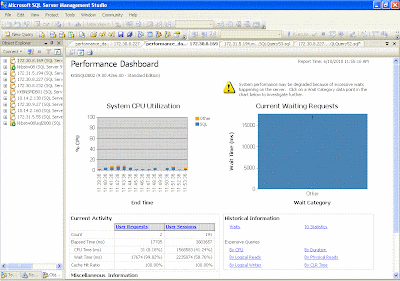
Performance Dashboard is a simple performance monitoring tool for SQL Server 2005 released by Microsoft which is absolutely FREE :) . Good and detailed explanation is given by Brad McGhee as usual over here. Let me briefly describe the salient features of it.
How to Set up?
* Download Performance dashboard.msi from here
* Install on the machine from which you want to monitor your production servers. The installation completes in seconds in 3-4 clicks and doesn't demand a restart.
* Proceed to C:\Program files\Microsoft SQL Server\90\Tools\PerformanceDashboard folder ( or the folder where you have installed SQL Server. Performance Dashboard is installed on the folder where where you have already installed SQL Server)
* Copy the Setup.sql script and execute it in the production servers to be monitored.
Thats it. You are ready to go.
How to use it?
* Open SSMS on the machine you installed Performance Dashboard.
* Connect to the instance/SQL Server to be monitored on the SSMS
* Right Click on the connect server on the object explorer
and Select Reports .
* Pick Custom Reports
* Select performance_dashboard_main.rdl from C:\Program files\Microsoft SQL Server\90\Tools\PerformanceDashboard
* And then experience the magic :)
Opening Dashboard Screen shot is provided below.
Why I like it?
* Can check CPU/Buffer cache hit ratio and overall health of Database Servers remotely from SSMS.
* Quickly check the recently ran expensive queries ( as per by IO/CPU/ along with their Query Plan
* Check the Database Size and Log file size, growth, and other paramaters with in a few clicks.
* Provides Missing indexes and suggestions to improve peformance. Also provides number of seeks/scans on the objects.
* Provides DB level IO stats like Reads, Write and their wait times.
* All these brilliant info at almost 0% cost on the monitored server.
Now for few minor cons.
* An alerting feature along with the tool would have been great.
* Also, there are one or two minor bugs for which solutions are already available.
* Ability to add perfmon counters as per our choice would have been even better.
* One cant do a direct copy or paste from the report, has to export to PDF /excel and then copy the required data.
But, am I asking for bit too much on a free tool. Definitely yes :) Inspite of these little cons,Performance Dashboard is a must have for all DBAs, especially if you are monitoring 25+ servers. Just very handy for quickly checking the overall state and health of the server without actually logging into the server. Other than showing larger picture, it helps even to narrow down up to the query level. Simply awesome stuff.
Wednesday, June 9, 2010
Performance Dashboard - SQL Server 2005 Performance monitoring tool
Subscribe to:
Post Comments (Atom)


No comments:
Post a Comment